

Who Really Deserves the Vezina?
- The 2021 NHL regular season ran only 56 games starting in January, creating an unusual statistical environment for Vezina Trophy evaluation.
- Teams played exclusively within their divisions, meaning goaltenders faced only six or seven opponents all season — making cross-division comparisons nearly impossible.
- Vezina ballots were due May 20, overlapping with the playoffs for the first time, raising questions about whether playoff performance could influence voter decisions.
- Clear Sight Analytics (CSA) data is the analytical framework used to evaluate goaltender performance and identify the most deserving Vezina candidate.
- Despite the COVID-19 limitations, statistical analysis remains the most reliable method for determining which goaltending performance was truly the best.
2021 was a year of wearing masks and taking shots in the arm. Business as usual for goaltenders.
Ok, ok, I’ll admit there were some strange things about the 2021 NHL regular season. The first is that it was simply the 2021 regular season; no mention of 2020 at all (and good riddance), because the pandemic-shortened 56-game schedule began in January. That regular season is still going on, by the way, and won’t finish until some teams complete the third game of their first-round playoff series.
Regular-season awards voting is traditionally done before the playoffs begin to avoid playoff performances biasing voters. That won’t happen this year, as ballots are due on May 20, and it’s impossible to know what the effect might be: we’ll discuss that in a future article predicting the Vezina winner.
Another strange and important wrinkle in this season is that teams only played others within their (newly minted) divisions. Teams always play within their division and conference more often than outside them, but this season was essentially four leagues playing in parallel with no crossover whatsoever. Weird.
All of these COVID-19 accommodations have made it especially difficult to draw apples-to-apples comparisons among the top goalies in the NHL.
How can we know with any certainty which goaltending performance was the best when every goalie faced a maximum of only six or seven teams?
In short, we can’t.
However, a winner will still be chosen, and analyzing solid performance data is the fairest and most reliable way to do it.
As we did for our midseason Vezina article, we’ll be using data kindly provided by Clear Sight Analytics (CSA), which we consider the most thorough and comprehensive analytical resource available for goaltending.
Before going any further, if you’re unfamiliar with CSA’s data, or just want a refresher, I strongly encourage you to read our new CSA data primer. It’s a relatively quick read, and lays out everything you need to understand the numbers we’ll be discussing below. Readers already intimately familiar with CSA through the many articles we’ve published using their information will appreciate not having to read the same explanations repeated in every article going forward.
You finished reading it? Maybe have it open in another tab for reference? Ok? Let’s go!
Dethroning The Expected Kings
As usual, the narratives around Vezina worthiness percolate up through the league and its media from their source in raw save percentage, modulated by some (mostly arbitrary) minimum games threshold (with a shot or two of Wins! to add a kick).
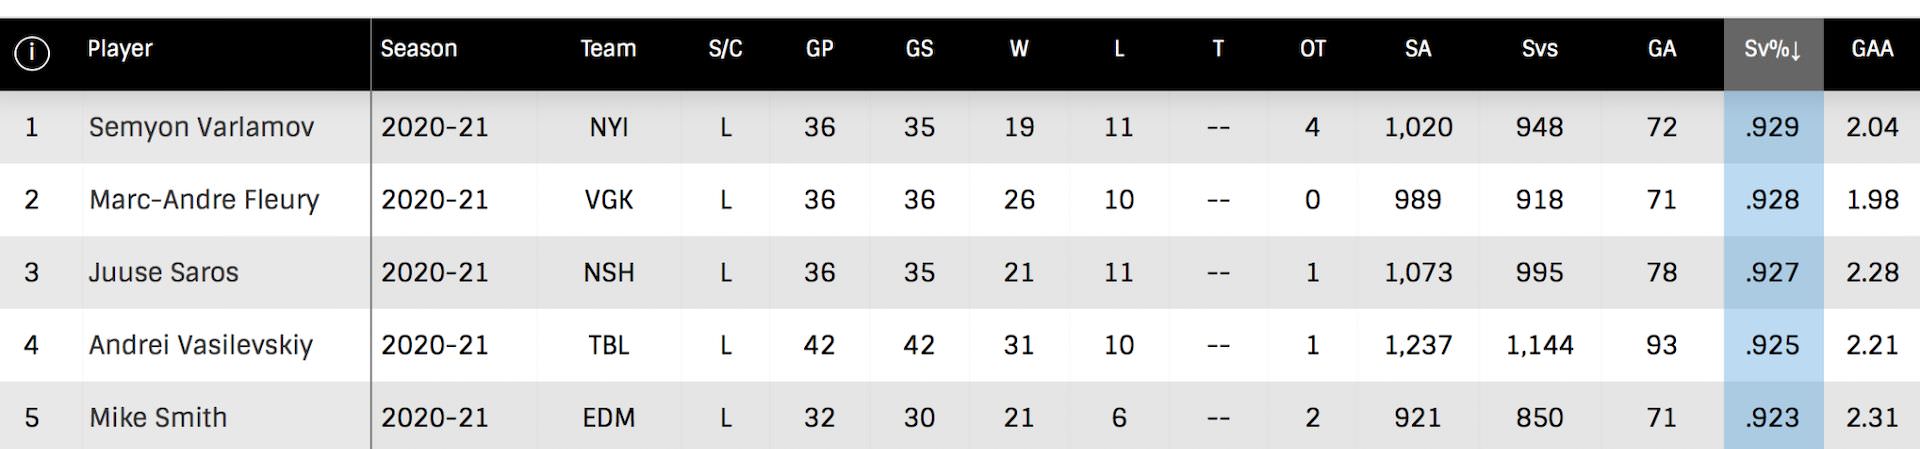
If we set the minimum games threshold to 30, and consider (as is tradition) only goalies with a winning record, our expected finalists would be taken from the following list of very talented keepers (statistics here taken from NHL.com):
If we were predicting the winner, instead of determining who really deserves the award, this would be the starting point, and after some alchemy and burnt offerings, we’d be able to state with remarkable accuracy who was going to win. Stay tuned for that bit of oracular magic in a later article.
However, in our current mode, at least two of these presumptive kings get lopped off the list, and not even from the bottom.
Let me let the data explain why.
The Power of Save Percentage Differential
Raw save percentage, as we see in the highlighted column above, treats every shot as having the same value. This unfairly punishes goalies playing behind terrible defences, as the quality of shot they face tends to be far greater.
As it turns out, Semyon Varlamov, 2021’s raw save percentage leader, is playing behind a very stingy defence, which significantly boosts his raw numbers. Of the top 27 goalies facing at least 200 chances, Varlamov had the fourth easiest environment to play in, behind only Jack Campbell, Alex Nedeljkovic, and Jeremy Swayman. When we take his baseline defensive environment into consideration, Varlamov played better than expected, but by a margin that ranks him only 13th in the NHL.
Mike Smith, while not nestling into as gentle and comfortable a defensive habitat as Varlamov, outperformed expectations just a bit better, ranking him 11th, and also out of the Vezina conversation.
Fleury, Vasilevskiy, and Saros rank second, fifth and seventh respectively on that list. Removing goalies who haven’t played in at least half their team’s games, they rank first, third, and fourth.
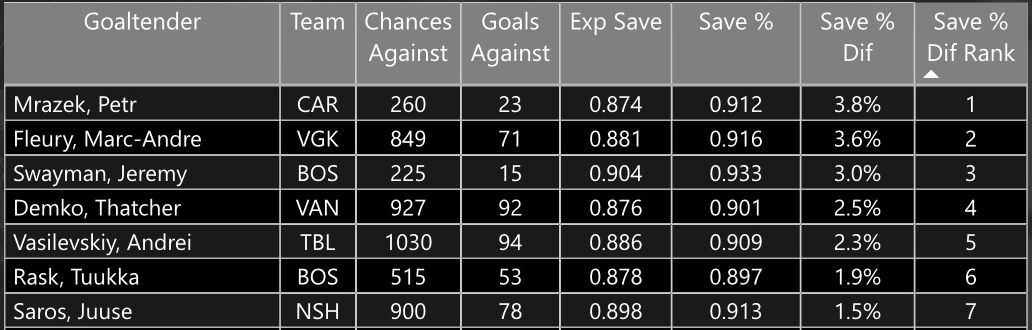
Fleury shows especially well here, earning a solid separation from the relevant field below him, leading Demko and Vasilevskiy by more than a full percentage point.
It may not seem like much, but consider how narrow the band of goaltending performance is. A goaltender posting a raw save percentage of 91% is a bit above league average. A single percentage point lower at 90%, and they’re sub-replacement level. A percentage point higher, at 92%, and they’re near the top of the league.
It’s worth mentioning that Demko, who did not appear on the NHL “usual suspects” list of top save-percentage goalies, played in the third worst defensive environment of the 27 goaltenders listed, which hurt his raw save percentage significantly. That being said (and with games still left to play), he should certainly be in the Vezina conversation.
Concretizing the Numbers: Goals Against Differential
While it’s great to outperform your defensive environment over a sample of 200 chances, the more chances you’ve faced, the more impressive your accomplishment becomes.
CSA’s Goal’s Against Differential helps with this computation by determining the number of goals a given keeper would be expected to allow (given the shot quality of chances they faced), and subtracting the actual number of goals allowed, to show how many goals a tendy saved (or cost!) their team over the course of a season.
As you can see, the list below rewards sustained quality over ephemeral brilliance:
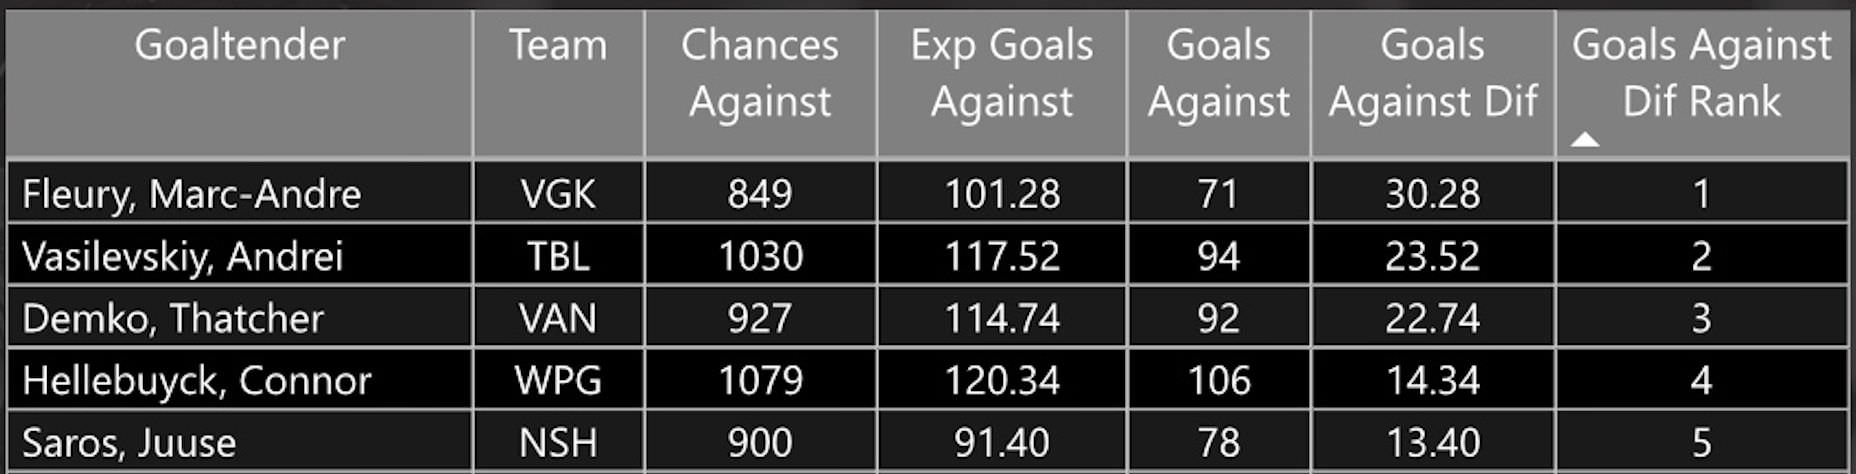
Hellebuyck’s emergence here is certainly no surprise to anyone who follows the Winnipeg Jets. The reigning Vezina winner played more games than anyone else this season, and made a significant positive impact on his team.
Most surprising, perhaps, is the fact that Vasilevskiy is such a distant second on this list, and that Demko, depending on how his season ends, could overtake him.
Although many believe Vasilevskiy will win the award easily this season, the data places him a distant second to Fleury both in Goals Against Differential and Save Percentage Differential, and in a virtual dead heat with Demko when both categories are considered together.
And the Winner Should Be?
Though Vasilevskiy has played more games and faced more chances (which does matter), Fleury has sustained his excellent play over a substantial workload too. He has outperformed his defensive environment and saved his team goals at a rate that elevates him well beyond his peers.
The clear winner should be Fleury. The only ambiguity should be whether Vasilevskiy or Demko deserves second place.