
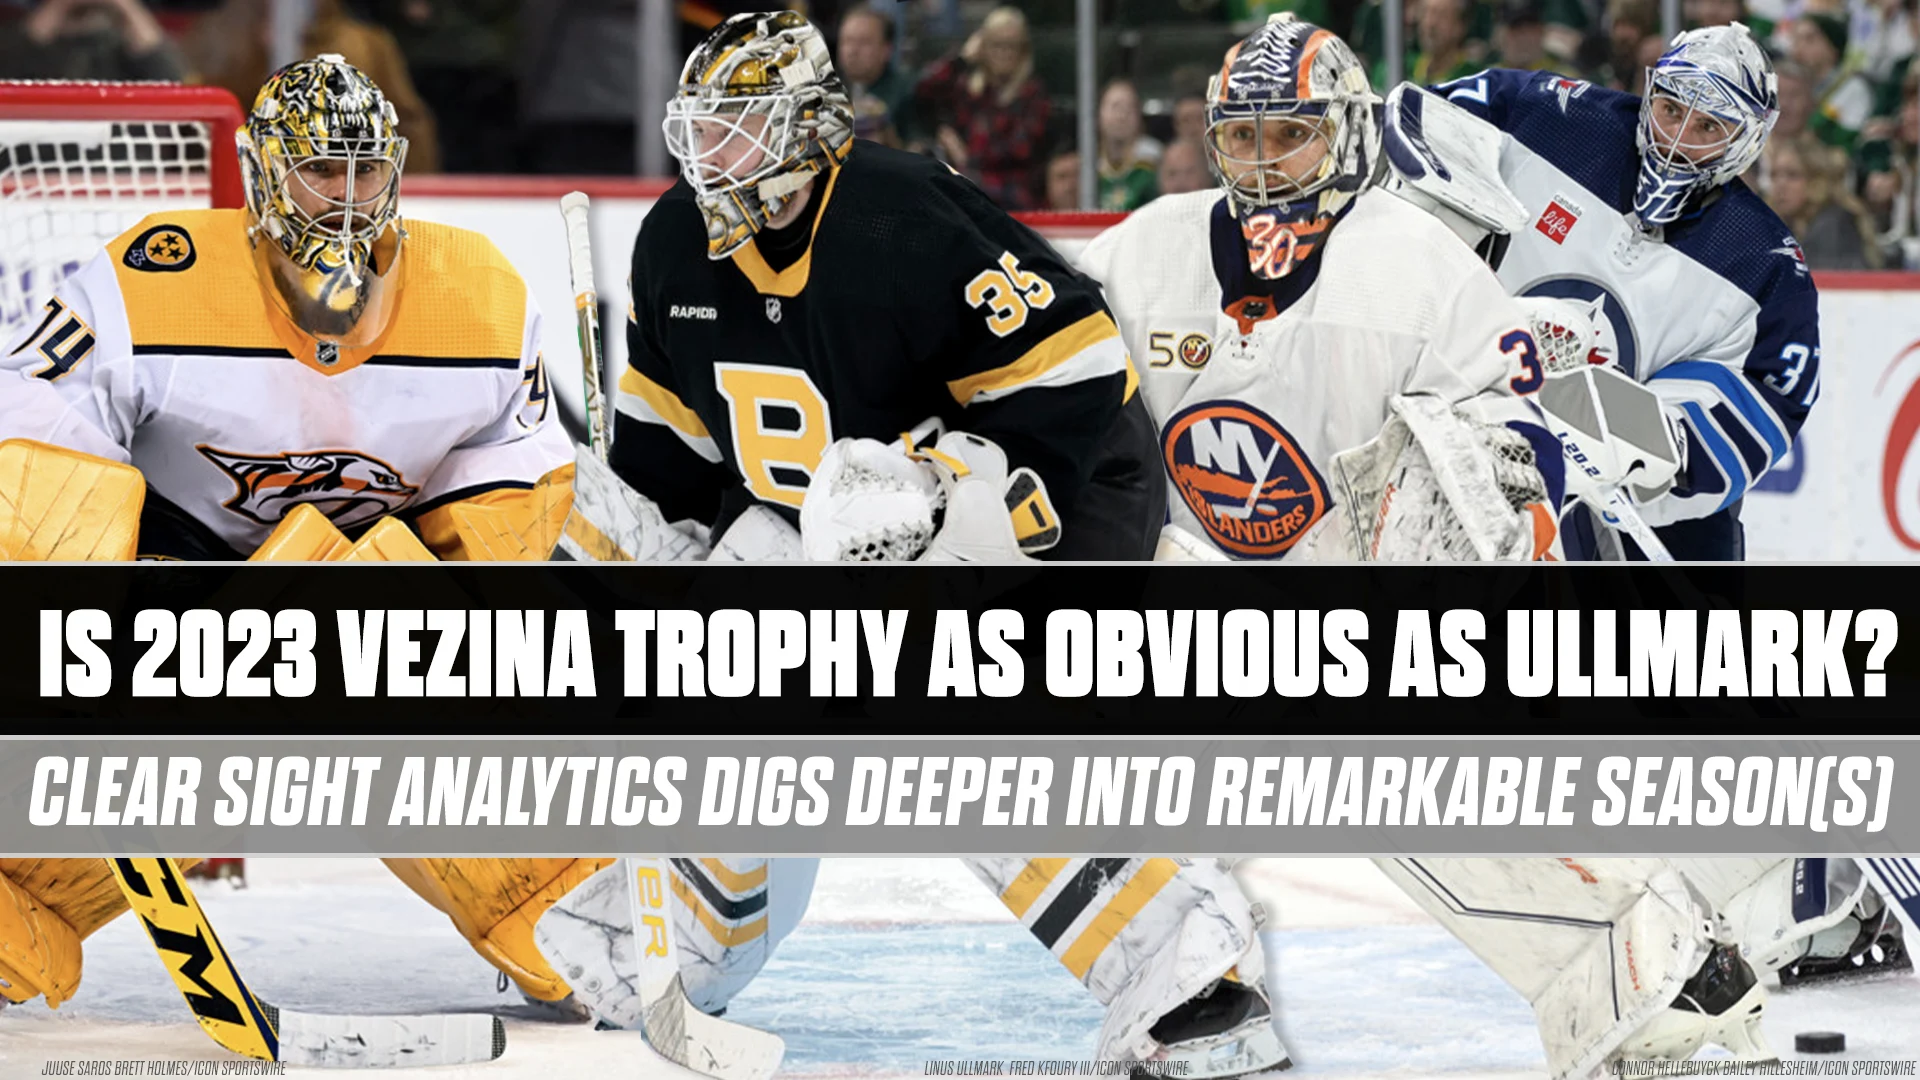
Is 2023 Vezina Trophy as Obvious as Ullmark?
- Linus Ullmark leads all NHL goalies in save percentage (.938) and GAA (1.89) while starting only 48 games in 2023.
- Ullmark tied Alexandar Georgiev for the NHL wins lead at 40, despite Georgiev starting 14 more games.
- Traditional Vezina metrics favor Ullmark, but playing behind a historically dominant Bruins team complicates a direct comparison with peers.
- Clear Sight Analytics uses 34 data points per shot — including shot location, type, screens, and pre-shot passes — to level the playing field between goalies on different teams.
- Juuse Saros and Connor Hellebuyck each started 64 games compared to Ullmark's 48, raising questions about how workload should factor into Vezina voting.
On the surface, the answer to who should win the Vezina Trophy seems obvious.
Linus Ullmark had incredible breakout season with the Boston Bruins, leads the NHL in save percentage (.938) and goals-against average (1.89), and tied with Alexandar Georgiev of the Colorado Avalanche for the most wins (40) despite starting just 48 games, 14 fewer.
By all the traditional metrics, Ullmark is a slam dunk to be named the League’s top goalie and win his first Vezina. But what do the analytics say? Can we account for the fact Ullmark played behind a record-setting Bruins team when comparing his results to other goalies? Should the fact he played fewer than 50 games compared to 64 each for Juuse Saros with the Nashville Predators and Connor Hellebuyck with the Winnipeg Jets matter? How much?
InGoal Magazine turned to Clear Sight Analytics to help solve those first couple of questions, and hopefully shed some light on the last two as well. Before you dig into those statistics, check out our primer on how Clear Sight Analytics quantifies shot quality using 34 data points on every shot to add context that includes everything from shot location and type (off the rush or in-zone), to whether the goalie was forced to go side to side by a pre-shot pass, or if they had to find a puck through screens, whether cause by an opponent of their own team.
As goalies we know not all shots are created equal. Trying to compare goalies playing behind different teams and systems is often apples to oranges, but Clear Sight Analytics helps level that playing field by quantifying the quality of the shots that each goalie faces.
Before we get to their numbers, though, take a look at the tradition statistics that used to be the default for the General Managers who vote on the Vezina Trophy: Wins and Save Percentage for goalies who have played at least 45-50 games.

By those simplistic standards, Ullmark clearly comes out on top, with Ilya Sorokin and Connor Hellebuyck the other two finalists, and Saros, Georgiev and Jake Oettinger of the Dallas Stars all in the mix. But what happens to save percentage when we factor in defensive environments?
For this we’ll use Save Percentage Differential from Clear Sight Analytics, a statistic that creates an expected save percentage for each goalie based on the quality of the shots they face (so the lower the expected save percentage, the harder their environment) and then measures how well they did relative to that. We expanded this to the top-20 because, as you will see below, there are some surprise additions (our threshold was also lower at 250 chances against), and there are a few goalies from the first list who wouldn’t make this cut off for a top-10.

Ullmark remains on top of the list with a +2.7% Save Percentage Differential, just slightly ahead of Filip Gustavsson of the Minnesota Wild, who would be a worthy Vezina finalist if not for the fact he only got 37 starts this season. So, what does +2.7% mean in simpler terms? For every 100 shots, Ullmark was 2.7 goals better than expected compared to NHL averages based on the quality of shots he faced. So, he saved the Bruins almost three goals for every 100 shots, which based on an average of 29.8 shots per game is every 3 games and one period. If that doesn’t resonate, consider the opposite end of the spectrum, with a couple of goalies who were -3.0%, or gave up roughly one more goal per game than they should. It’s significant.

The biggest climb amongst potential candidates when we look at save percentage differential is Nashville’s Juuse Saros.
Photo: Brett Holmes/Icon Sportswire
Back to the overall list of potential Vezina candidates, the biggest climb, relative to raw save percentage, is Saros at +2.0%, who climbed just ahead of Sorokin at 1.7% and well past other initial list contenders like Hellebuyck (+1.4%), Georgiev (+1.3%) and Oettinger (+0.9%).
As for the defensive environment, it’s true that Ullmark’s was favourable with an expected .899 that was 10 points higher than the NHL average of .889 tracked by Clear Sight Analytics (and remember, they only count shots actually on net, which is why these numbers differ because the NHL tends to overcount shots headed wide). But all of the other Vezina contenders were either at NHL average (Saros was the lowest at .899), and a lot of the narratives about other goalies facing tougher chances don’t come through in the adjusted statistics, with Sorokin (.893), Georgiev (.893), Hellebuyck (.896) and Oettinger (.898) also above League average.
It’s mostly the backups like Semyon Varlamov and Jaroslav Halak who are well below that number, which shows how getting tougher starts behind the same team affects stats.
At the end of the day, when adjusting for shot quality, Ullmark was still No. 1.
WHAT ABOUT WORKLOAD?
Of course, Save Percentage Differential is more of a rate stat. When it comes to cumulative results, we need to look more at Clear Sight Analytics Goals Saved Above Expected for the season, which adds quantity to those shot quality measurements. A top-10 would probably have been enough but (as you’ll see in the extra notes below, it’s always nice to add a little context on other performances league wide) so here’s the top-20:

This is the one spot Ullmark does not come out on top, with the combination of quality and quantity for Saros putting him atop the NHL in goals saved above expected at 37.86. Ullmark isn’t far behind at 33.44 and the list drops off to the other likely Vezina finalists, with Sorokin next at 26.49, followed by the perhaps too widely overlooked Andrei Vasilevskiy at 24.31, then Hellebuyck also boosted by his incredible workload at 23.45 and Oettinger at 14.02.
Whether or not you think that’s enough to boost Saros past Ullmark is for you to decide.
You might fairly argue it’s not Ullmark’s fault he played less as the Bruins managed minutes amid a record-setting season with the Stanley Cup a priority, while Saros played a ton behind a Predators team just trying — and ultimately failing — to get into the playoffs. You could also argue that maintain such a high level of play amid all those starts is worth more, something that might also vault Hellebuyck, who played 17 straight, into consideration.
ADDING MORE SHOT QUALITY CONTEXT
With the answer perhaps less clear because of playing time, lets dig further into the adjusted numbers from Clear Sight Analytics, starting with a look at high-danger chances.
Saros faced more of the toughest shots than any other goalie in the NHL this season with 457 high-percentage chances, and had the best adjusted save percentage on those chances at +5.9%. Joonas Korpisalo was second at +5.8% on 255 high-percentage chances, and Ullmark was third at +5.0% on 269 chances. Vasilevskiy was fourth at +4.5% on 414 chances (so much for all the talk of great Tampa D), Georgiev was fifth at +4.3% on 378 chances, Hellebuyck was 10th at +2.2% on 403 chances and Sorokin finished 13th at +1.3% on 352 chances.
The fact Ullmark faced the fewest may be held against him, but considering how many fewer games he played, the differences aren’t as stark: Vasilevskiy faced a high-percentage shot on 25.3% of his chances, next was Saros at 24.3%, Hellebuyck at 23.5%, Georgiev at 22.8%, Sorokin at 22.6% and Ullmark at 21.9%. Using percentages, the gap is not as big.

Low percentage goals can be backbreakers and nobody is better at ensuring it doesn’t happen to his team than the Islanders Ilya Sorokin.
Photo: Katherine Gawlik/Icon Sportswire
It may also be worth considering low-percentage chances, since we know that giving up bad goals can be as bad as stopping tough chances is good (according to Clear Sight Analytics, if a goalie surrenders a low-percentage goal in a game, the team loses 87 percent of the time unless the goalie at the other end reciprocates with a low-percentage goal of their own).
Sorokin leads the way here at +1.0% with 9 goals on 939 chances; Hellebuyck is next among the likely finalists (and 5th overall) at +0.7% with 13 goals on 1067 chances; Ullmark follows him (8th overall) at +0.6% with 10 goals on 766 chances; Vasilevskiy is 12th overall at +0.4% with 15 goals on 991 chances; Saros is 13th at +0.4% with 19 goals on 1142 chances; Georgiev is 19th at +0.2% with 17 goals on 1014 chances; and Oettinger is 26th at +0.1% with 17 on 964 chances.
Other Items From the CSA SV% Differential List Worth Noting for Playoffs:
- Akira Schmid, in an admittedly small sample, appears to have played himself into a worthy emergency option in New Jersey should Vanacek falter.
- Laurent Broissoit, coming off hip surgery that left him in the AHL for most of the season, has earned his Game 1 start for the Vegas Golden Knights in a similarly small sample.
- Joonas Korpisalo was a wise trade deadline addition for the Los Angeles Kings.
- Ilya Samsonov, despite some ups and downs, should be the unquestioned Game 1 starter for the Toronto Maple Leafs at +1.1% compared to Matt Murray at -0.5%.
- And Alex Lyon has been full value, but not playing at a spectacular (and therefore unsustainable) level, to get the Florida Panthers into the playoffs.
QUALITY STARTS
Clear Sight Analytics added quality starts to its metrics this season, splitting the categories into average game, quality game, great game and stolen win on the positive side, and bad game, blown game and goalie bailed out on the negative side of the ledger.
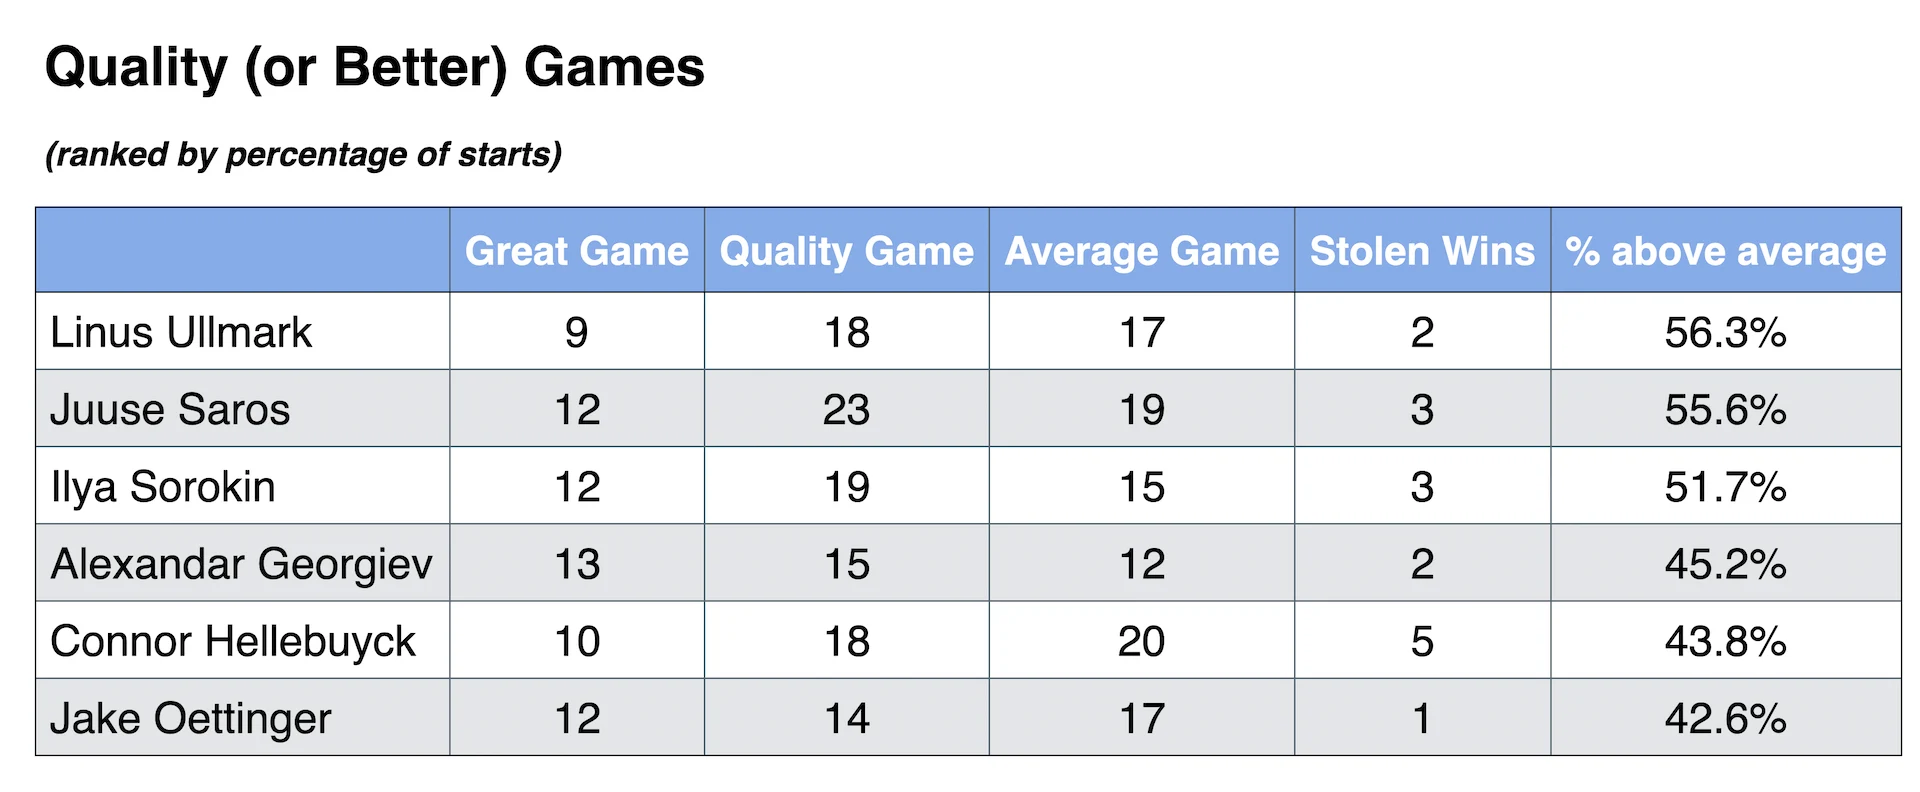
Saros topped the NHL with 35 quality (23) and great (12) games combined; Sorokin was next with 31 combined (19-12); Hellebuyck had 28 (18-10); Georgiev had 28 (15-13); Ullmark had 27 (18-9) and Oettinger had 26 (14-12). As a percentage of starts, however, Ullmark actually comes out on top with 56.3% of his starts either quality of great games, followed by Saros (55.5%), Sorokin (51.7%), Georgiev (45.2%), Hellebuyck (43.8%) and Oettinger (42.6%).

On the flip side are bad or blown games for each of the contending goalies.
Georgiev had the most (22), followed by Oettinger (19) Sorokin and Hellebuyck (16), Vasilevskiy (14), Saros (10) and Ullmark with just five. Again, by start percentage things tighten up, but Ullmark has the best results at just 10.4% of his starts falling into the “bad” or “blown” game category, ahead of Saros next at 15.8%, Hellebuyck (25%), Sorokin (26.7%), Oettinger (31.1%) and Georgiev (35.5%), remembering these are all relative to shot quality in those games.

As far as InGoal is concerned at the 2023 NHL awards we should see the on stage version of the goalie hug
as Linus Ullmark celebrates his first Vezina Trophy win with goalie partner Jeremy Swayman.
Photo: Fred Kfoury III/Icon Sportswire
ADDING IT ALL UP AND …
At the very least, it’s clear Saros should be a finalist, which wasn’t necessarily the case when looking at that first list and hasn’t been true in a lot of the Vezina stories to date.
For InGoal, however, it’s still Ullmark who should win his first Vezina Trophy, with Saros and Sorokin finishing as finalists, likely in that order, behind him.