The NHL announced three finalists for the Vezina Trophy this week, with betting favourite Connor Hellebuyck of the Winnipeg Jets joined by Thatcher Demko of the Vancouver Canucks and two-time winner Sergei Bobrovsky of the Columbus Blue Jackets.
Did the NHL general managers who vote on the award get their top-3 right?
As we have in past seasons, InGoal Magazine will dig into the numbers that matter to general managers (wins and save percentage), then dig deeper into numbers that should matter more, adding shot quality context with help from Clear Sight Analytics.
When we performed a similar exercise last season, it confirmed Linus Ullmark was a worthy winner, but showed Juuse Saros was an absurd omission as a finalist.
What will the numbers show us about this year’s candidates? Any glaring omissions?
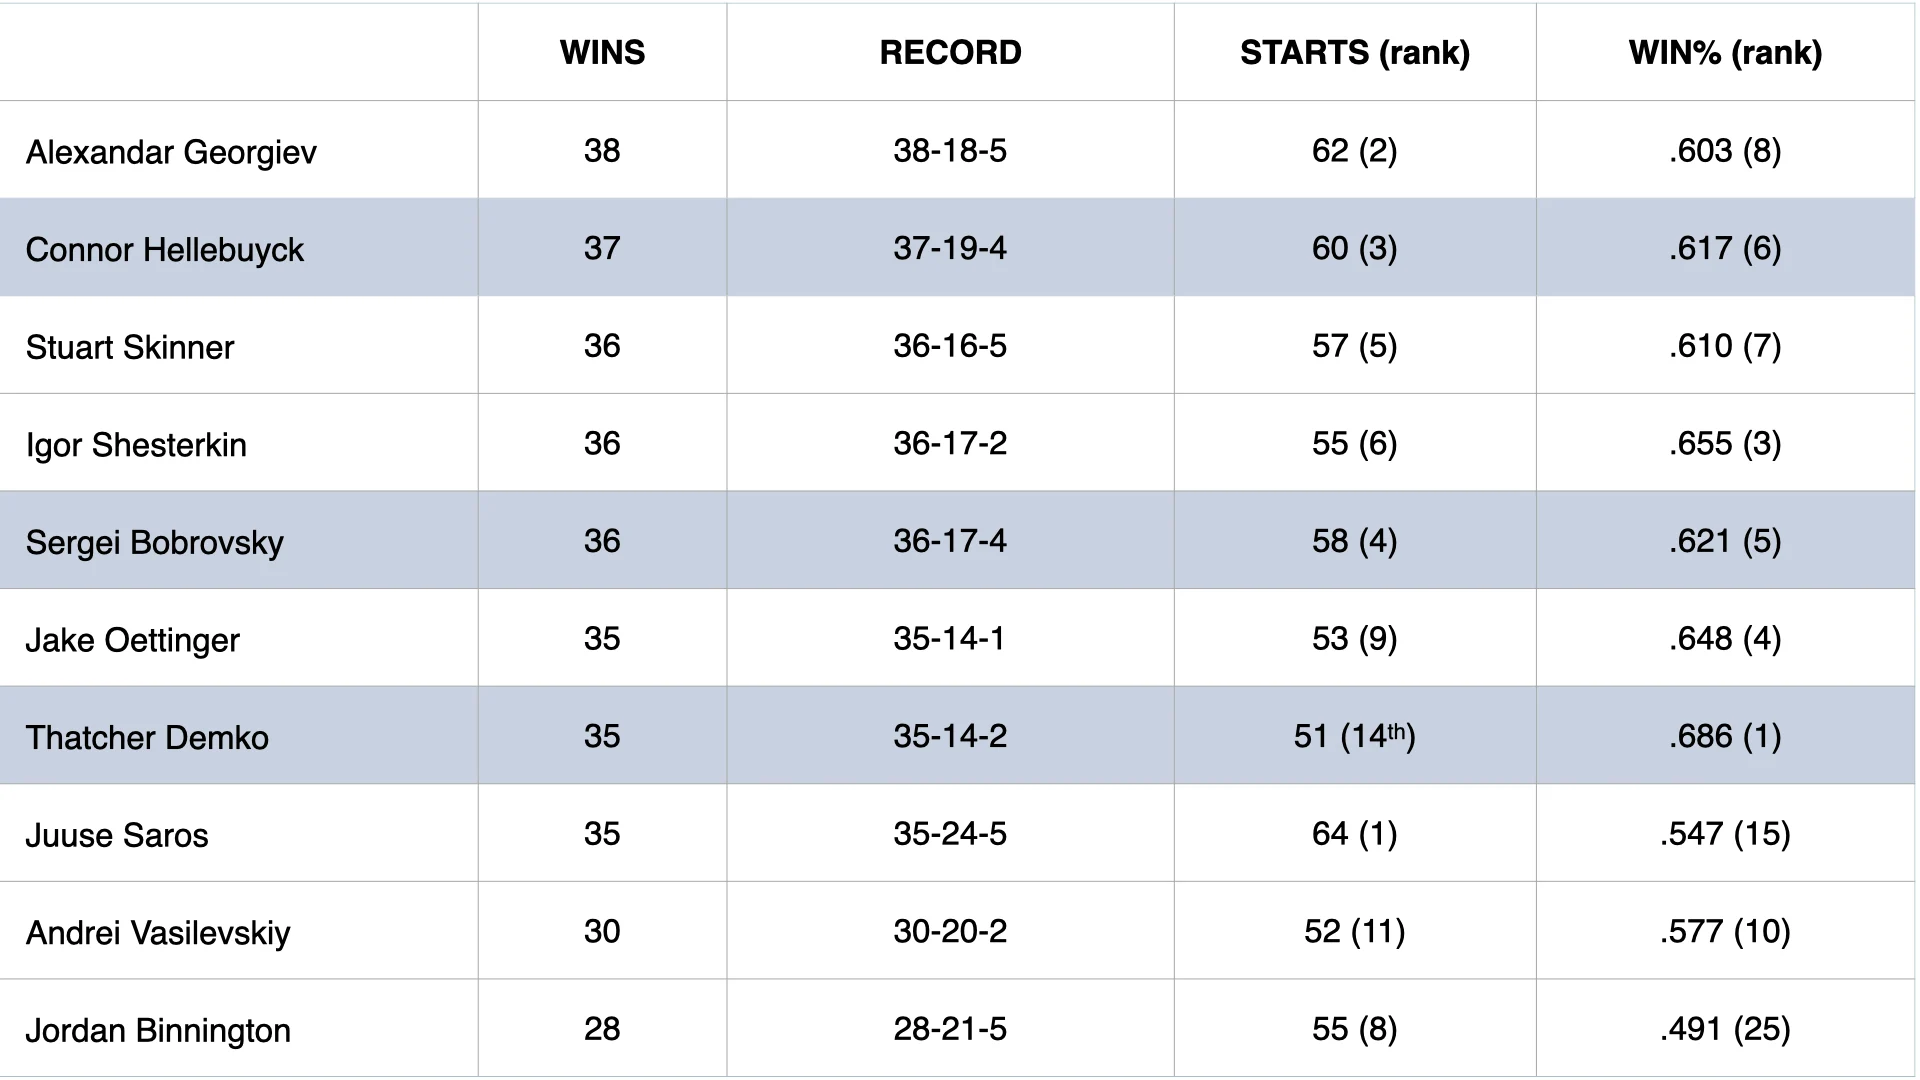
We’ll start with the obvious predictive measurements GMs seem to rely on:


Shutouts are another publicly available statistic that seem to get traction in this debate, though as one long-time NHL goalie coach pointed out during a season in which one goalie was running away atop this list: if the rest of your numbers are similar does that mean you had the same number of bad games and were therefore less consistent?

By those basic metrics, it’s easy to sell a final 3 of Hellebuyck, Demko and Bobrovsky, especially since the other goalies near the top of the wins list were further down the other lists, though Shesterkin is right there with them. But much like wins, we could argue that save percentage is also largely a team statistic because the quality of shots can vary so widely from team to team, and in some cases even among goalies on the same team.
With adding the context of shot quality it really is an apples-to-oranges comparison.
That’s where Clear Sight Analytics comes in with numbers to quantify the quality of shots each goalie faces and help level the statistical playing field.
Before you dig into those statistics, however, check out our primer on how Clear Sight Analytics quantifies shot quality using 34 data points on every shot to add context that includes everything from shot location and type (off the rush or in-zone), to whether the goalie was forced to go side to side by a pre-shot pass, or if they had to find a puck through screens, whether caused by an opponent of their own team.
To factor in varying defensive environments, we’ll start with Save Percentage Differential, a statistic that creates an expected save percentage for each goalie based on the quality of the shots they face (so the lower the expected save percentage, the harder their environment) and then measures how well they did relative to that. We expanded this to the top-20 because, as you will see, there are some surprise additions (our threshold was lower at 550 chances), and a few top goalies by raw save percentage and wins from the first list wouldn’t make the cut off if we restricted it to a top-10 list. In fact, one of the finalists would barely make the cut if we limited it to a top-20 list, which is telling.

Several things jump out from that chart, but none more than seeing Bobrovsky, a Vezina finalist according to general managers, ranked 20th in adjusted save percentage, especially when his playing partner, Panthers backup Anthony Stolarz, finished first.
There are several other names on that list that might surprise some people, including Jordan Binnington of the St. Louis Blues, who has been a subject of these statistical deep dives in the past, second to Stolarz and ahead of finalists Hellebuyck and Demko. Other names worth noting on that list include Hellebuyck’s playing partner, Laurent Brossoit, who had similar numbers but behind an easier environment in his starts in Winnipeg.
Other top-20 names that might surprise some include pending UFA David Rittich of the Los Angeles Kings, Joseph Woll of the Toronto Maple Leafs (told you he was posting Vezina worthy numbers before the ankle injury), Binnington’s young crease mate Joel Hofer (good job, goalie coach Dave Alexander), both Bruins goalies (but how many would have guessed Ullmark was ahead of Swayman), a resurgent Jonathan Quick, Semyon Varlamov being full value for his playoff starts with the New York Islanders, Cayden Primeau having a breakthrough season with the Montreal Canadiens, and both of the Buffalo Sabres young tandem, Luukkonen and rookie Devon Levi finishing in the top-20. Woll, Levi and Jacob Markstrom did it behind the toughest environments, with expected save percentages at or near .880, well below the NHL average expected save percentage of .891.
WHAT ABOUT WORKLOAD?
Of course, Save Percentage Differential is more of a rate stat. When it comes to cumulative results, we need to look more at Clear Sight Analytics Goals Saved Above Expected for the season, which adds quantity to those shot quality measurements. A top-10 would probably have been enough but (as we saw from the stats above and will again below, it’s always nice to add a little context on other performances league wide) so here’s the top-20:

So, are we saying Jordan Binnington should win the Vezina based on these statistics?
No. What Hellebuyck did this season requires more context, including the fact he won so often without much margin for error behind a Jets team that defended well but struggled to score. With Winnipeg tied or ahead by one goal, Hellebuyck posted 26.79 of his 27.24 goals saved above expected, the only one top-5 in both categories and the top combined total.
It may also be worth looking deeper into how they fared against the toughest shots:

It is also worth checking out how goalies did on low-danger chances because big saves can be undone by bad goals, with teams losing 74 percent of the games their goalie gives up a low-percentage goal unless the other goalie reciprocates (it’s down from 87 percent).

Add it all up, and Hellebuyck will be a worth winner. Demko will be a worthy finalist even after missing five weeks to injury. But it’s at least fair to argue the Binnington — and Shesterkin or Markstrom too — should have been finalists ahead of Bobrovsky.
Comments
Let's talk goaltending!
We welcome your contribution to the comments on this and all articles at InGoal. We ask that you keep it positive and appropriate for all - this is a community of goaltenders and we're here for each other! See our comment policy for more information.


Thoughtful & fun article.
While I usually disagree with GM Vezina selections, it is reasonable they weight wins heavily. The award criteria is simply, “adjudged to be the best at this position.” Since winning is the metric GMs are ultimately judged on, it’s reasonable they evaluate goaltenders in that manner.
I also think there is an inherent problem using advanced metrics. Different databases vary widely. While some are clearly better than others, there is a lack of public transparency to adjudicate methodology. There can be no agreement without agreed upon standards.
(Historically would Gilles Meloche with his heavy workload and high volume of quality saves be worthier than Ken Dryden due to differentials and “saves above expected?” Perhaps, but good luck defending that argument.)
Even if there were agreement on methodology, statistics should only part of the “adjudgment.” How valuable is the ability of a goalie to stay healthy? Is he a team leader? Has he helped change team culture? All are determinative to success. Which has the greater weight in a long season?
There is already a statistical award for goalies – the Jennings. The Vezina should have more holistic criteria, more than wins, but more than statistics as well.
I think the best solution is to move voting to peer judgement: rostered goaltenders and goalie coaches.